Lucidum MoM (Manager of Managers) allows you to manage multiple Lucidum systems from a single browser session.
Adding Lucidum Systems to Lucidum MoM #
Before you can monitor your Lucidum systems with MoM, you must first add the systems to MoM. To do this:
-
Log in to the first Lucidum system you want to monitor with MoM.
-
Note the fully-qualified domain name (FQDN) for the Lucidum system. The fully qualified domain name for a Lucidum system is usually <instance name>.lucidum.cloud. You can check the URL to find the FQDN.
-
Create a new user account to be used by MoM.
-
Generate a bearer token for the new user account. Copy and store the token locally. You will need it in step 8.
-
Repeat steps 1-4 for each Lucidum system you want to monitor with MoM.
-
Log in to MoM.
-
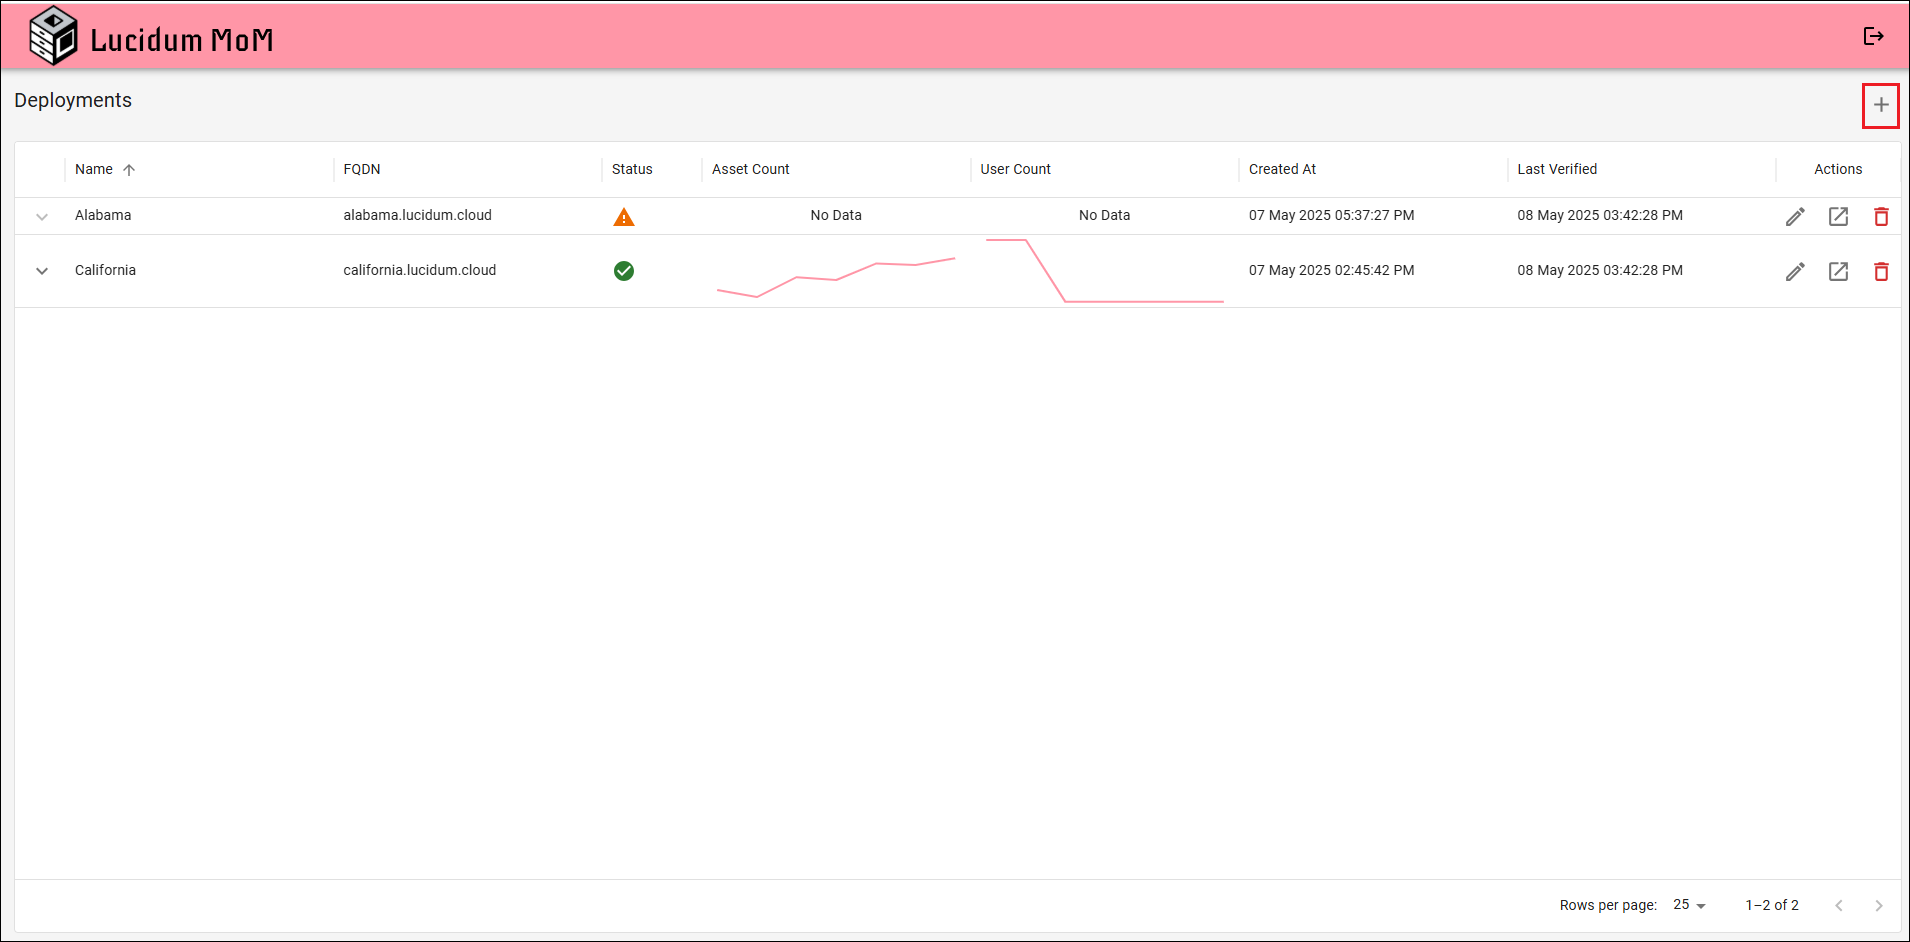
Click the Add Deployment (plus-sign) icon in the upper right.
-
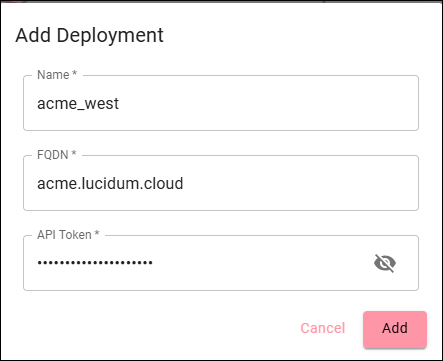
In the Add Deployment modal page, enter the following:
-
Name. User-friendly name for the Lucidum system.
-
FQDN. The full-qualified domain name for the Lucidum system.
-
API Token. The bearer token you generated for the new MoM user.
-
-
Repeat steps 6-8 for each Lucidum system you want to add to MoM.
Viewing Status of Lucidum Systems #
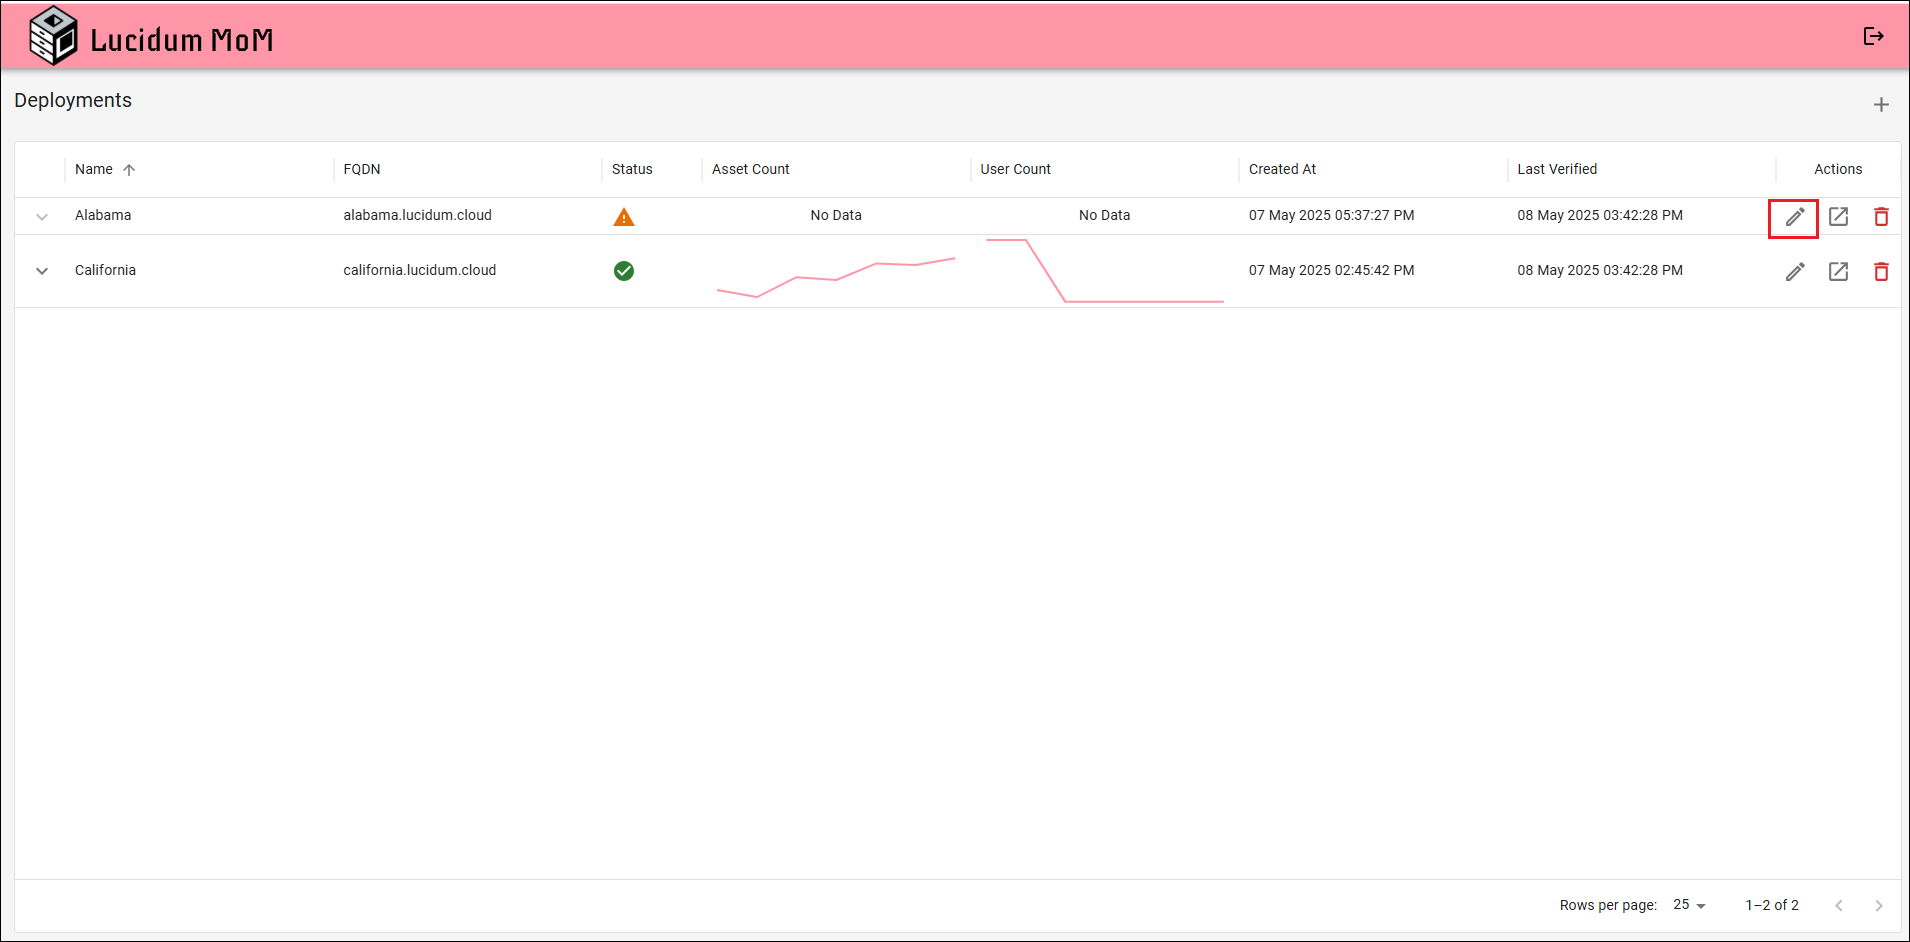
After you successfully add Lucidum systems to MoM, you can monitor the status of those systems.
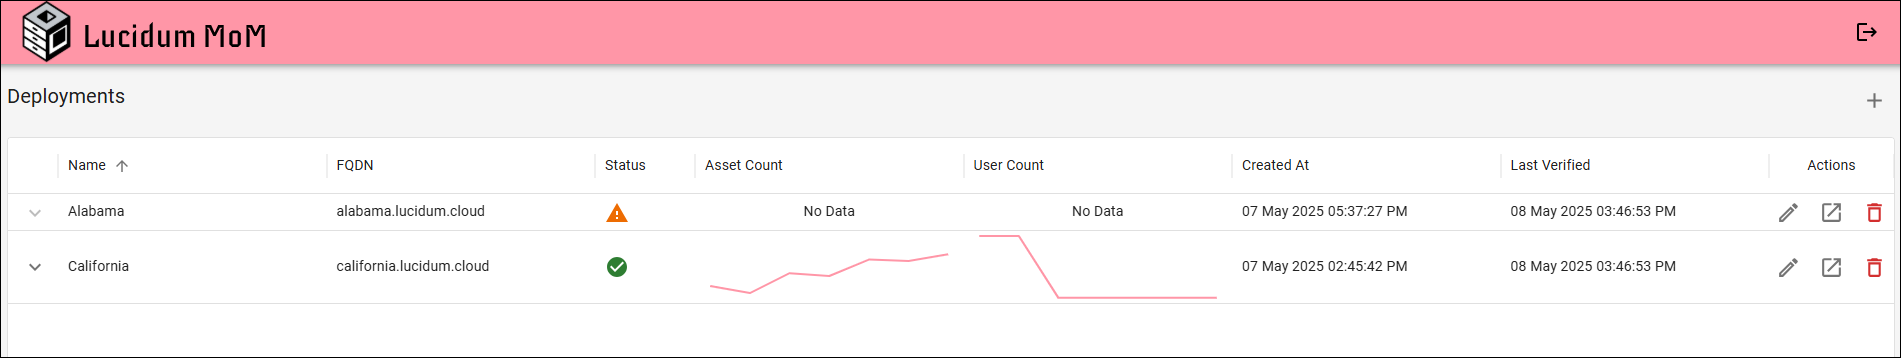
MoM displays the following about each Lucidum system:
-
Name. The user-friendly name of the Lucidum system.
-
FQDN. The FQDN of the Lucidum system.
-
Status. Specifies the status of the connection between the Lucidum system and MoM. Choice are:
-
 Unable to connect via API. Check the API bearer token. If necessary, re-generate the token and edit the deployment. with the new token.
 -
 Successful connection. MoM successfully connected to the Lucidum system.
 -
 Connection failed. MoM cannot communicate with the Lucidum system. Ensure that the Lucidum system is up and running. Ensure that the FQDN is correct. Ensure that there is network line-of-sight, for example, search for firewall rules that might prevent a connection between the Lucidum system and MoM.
-
-
Asset Count. A line graph that displays the number of assets managed by the Lucidum system for the past week. Mousing over the line graph displays the number of assets under management for a specific day.
-
User Count. A line graph that displays the number of users managed by the Lucidum system for the past week. Mousing over the line graph displays the number of user under management for a specific day.
-
Created. Date and time the Lucidum system was added to MoM.
-
Last Verified. Latest date and time that MoM retrieved status, asset count, and user count from the Lucidum system.
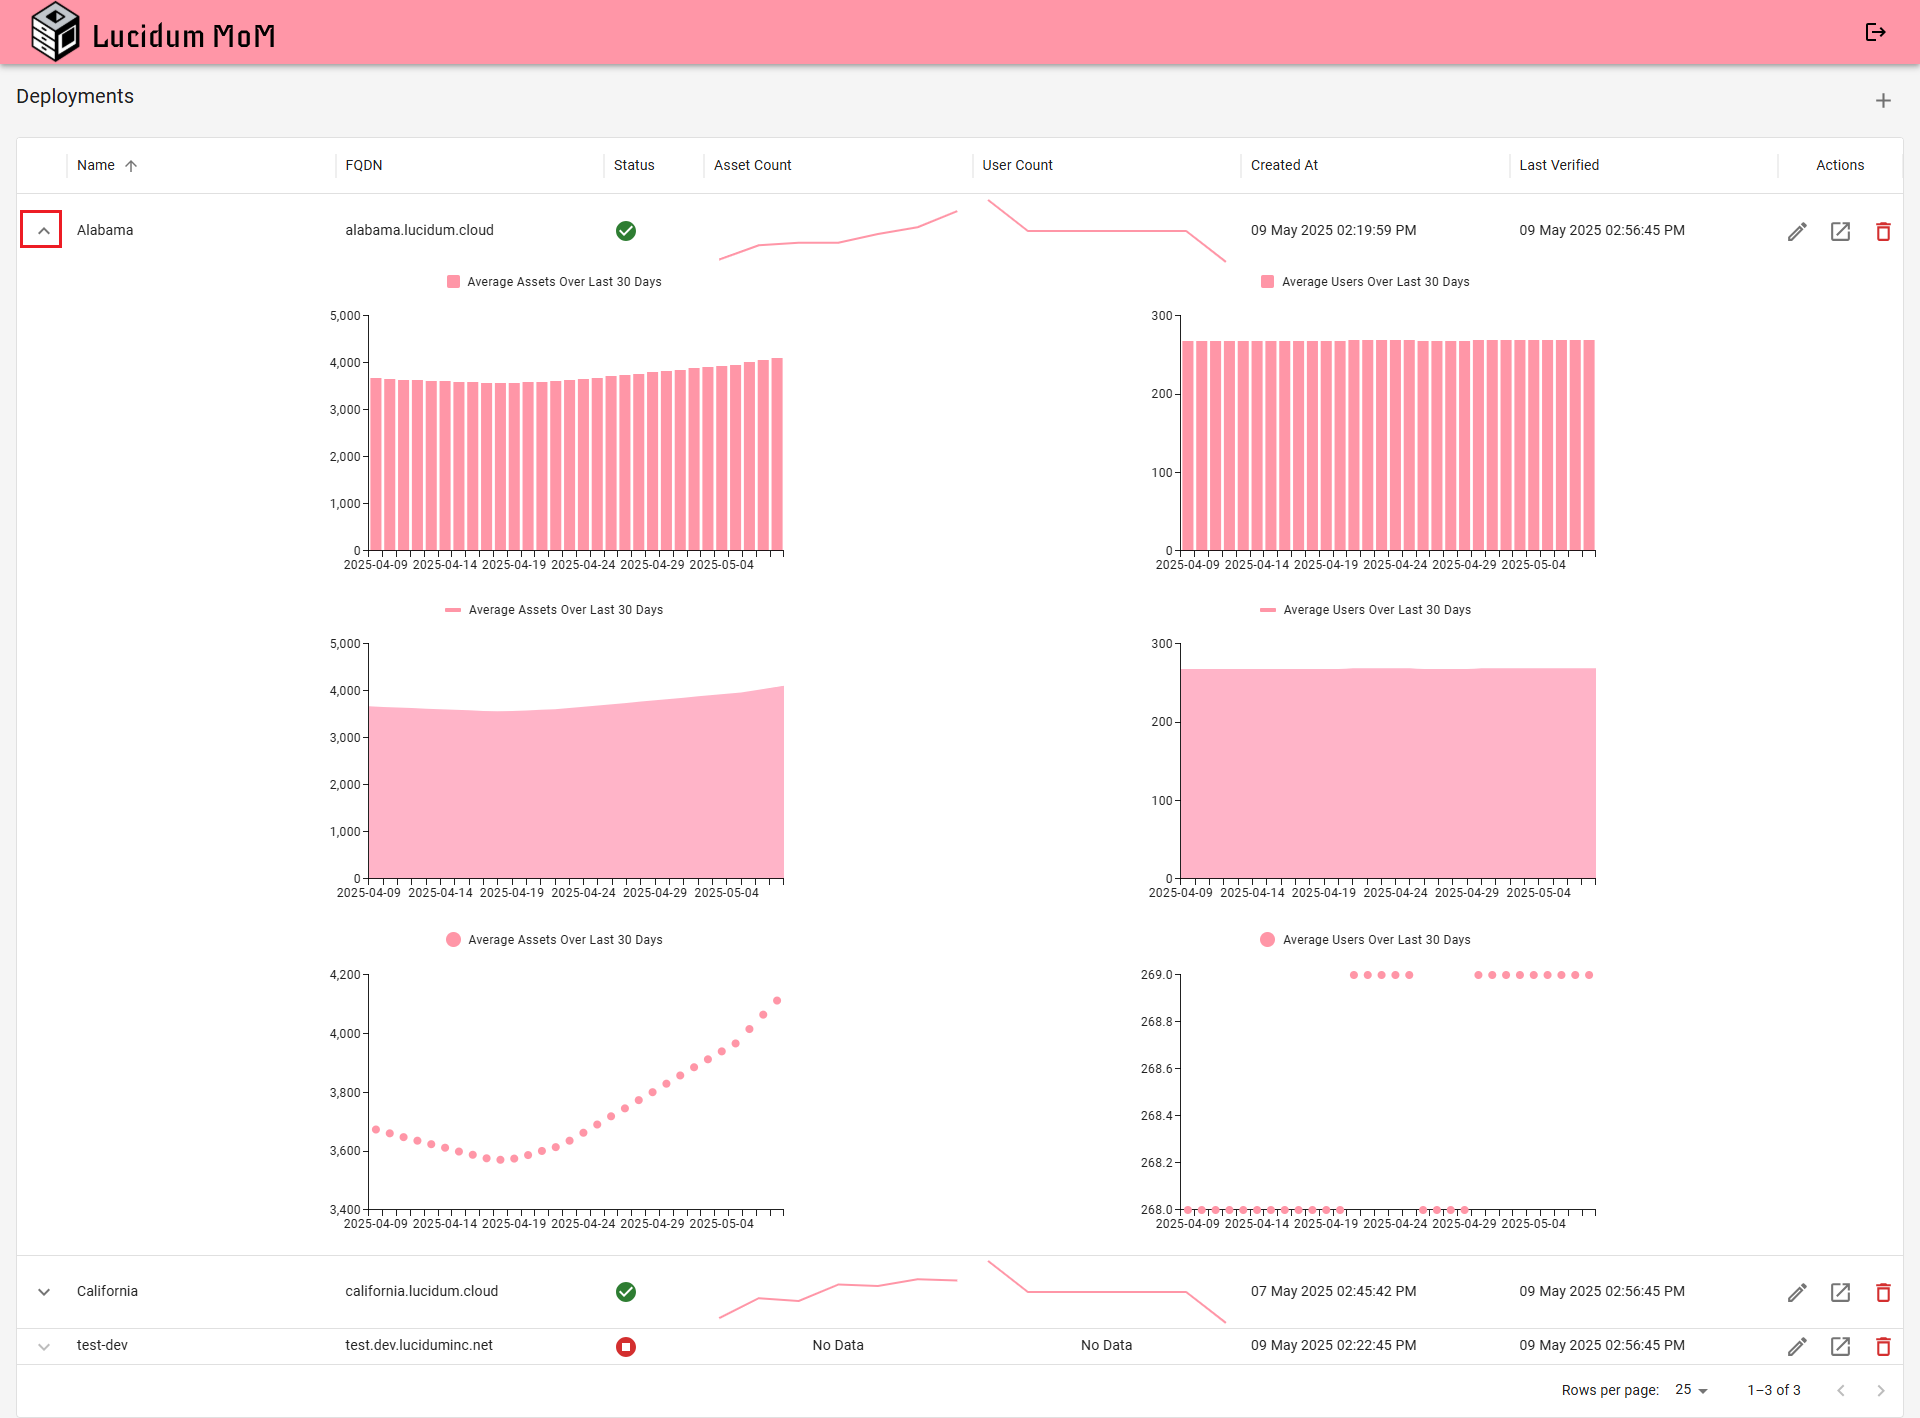
To open the drawer for a deployment, click on the down arrow to the left of the name. You can then view the the following graphs:
-
Average Assets Over Last 30 Days (bar graph). The graph on the top left displays a separate bar for each day, with 30 days of bars. The x-axis displays date. The y-axis displays number of assets. The bar represents the average number of assets for that day. Mousing over a bar displays the number of assets and the date.
-
Average Assets Over Last 30 Days (area chart). The graph on the middle left displays an area chart. The x-axis displays date. The y-axis displays number of assets. The area represents the average number of assets over time. Mousing over the area displays the average number of assets and the date.
-
Average Assets Over Last 30 Days (scatter chart). The graph on the lower left displays a scatter plot. The x-axis displays date. The y-axis displays number of assets. Each dot represents the average number of assets for that day. Mousing over a dot displays the average number of assets for that day.
-
Average Users Over Last 30 Days (bar graph). The graph on the top left displays a separate bar for each day, with 30 days of bars. The x-axis displays date. The y-axis displays number of users. The bar represents the average number of users for that day. Mousing over a bar displays the number of users and the date.
-
Average Users Over Last 30 Days (area chart). The graph on the middle left displays an area chart. The x-axis displays date. The y-axis displays number of users. The area represents the average number of users over time. Mousing over the area displays the average number of users and the date.
-
Average Users Over Last 30 Days (scatter chart). The graph on the lower left displays a scatter plot. The x-axis displays date. The y-axis displays number of users. Each dot represents the average number of users for that day. Mousing over a dot displays the average number of users for that day.
Editing a Deployment #
If MoM displays one of the following statuses:
-
Unable to connect via API
-
Connection failed
you must check the FQDN and bearer token for the deployment. To do this:
-
Log in to MoM.
-
Find the Lucidum system you need to edit.
-
Click the Edit Deployment (pencil) icon for the Lucidum system.
-
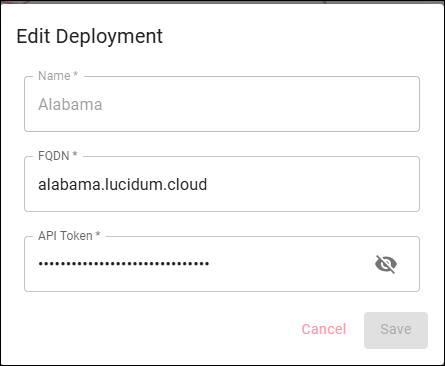
In the Edit Deployment modal page, you can edit one or more of the following:
-
Name. User-friendly name for the Lucidum system.
-
FQDN. The full-qualified domain name for the Lucidum system.
-
API Token. The bearer token for the MoM user.
-
Managing Lucidum Systems from MoM #
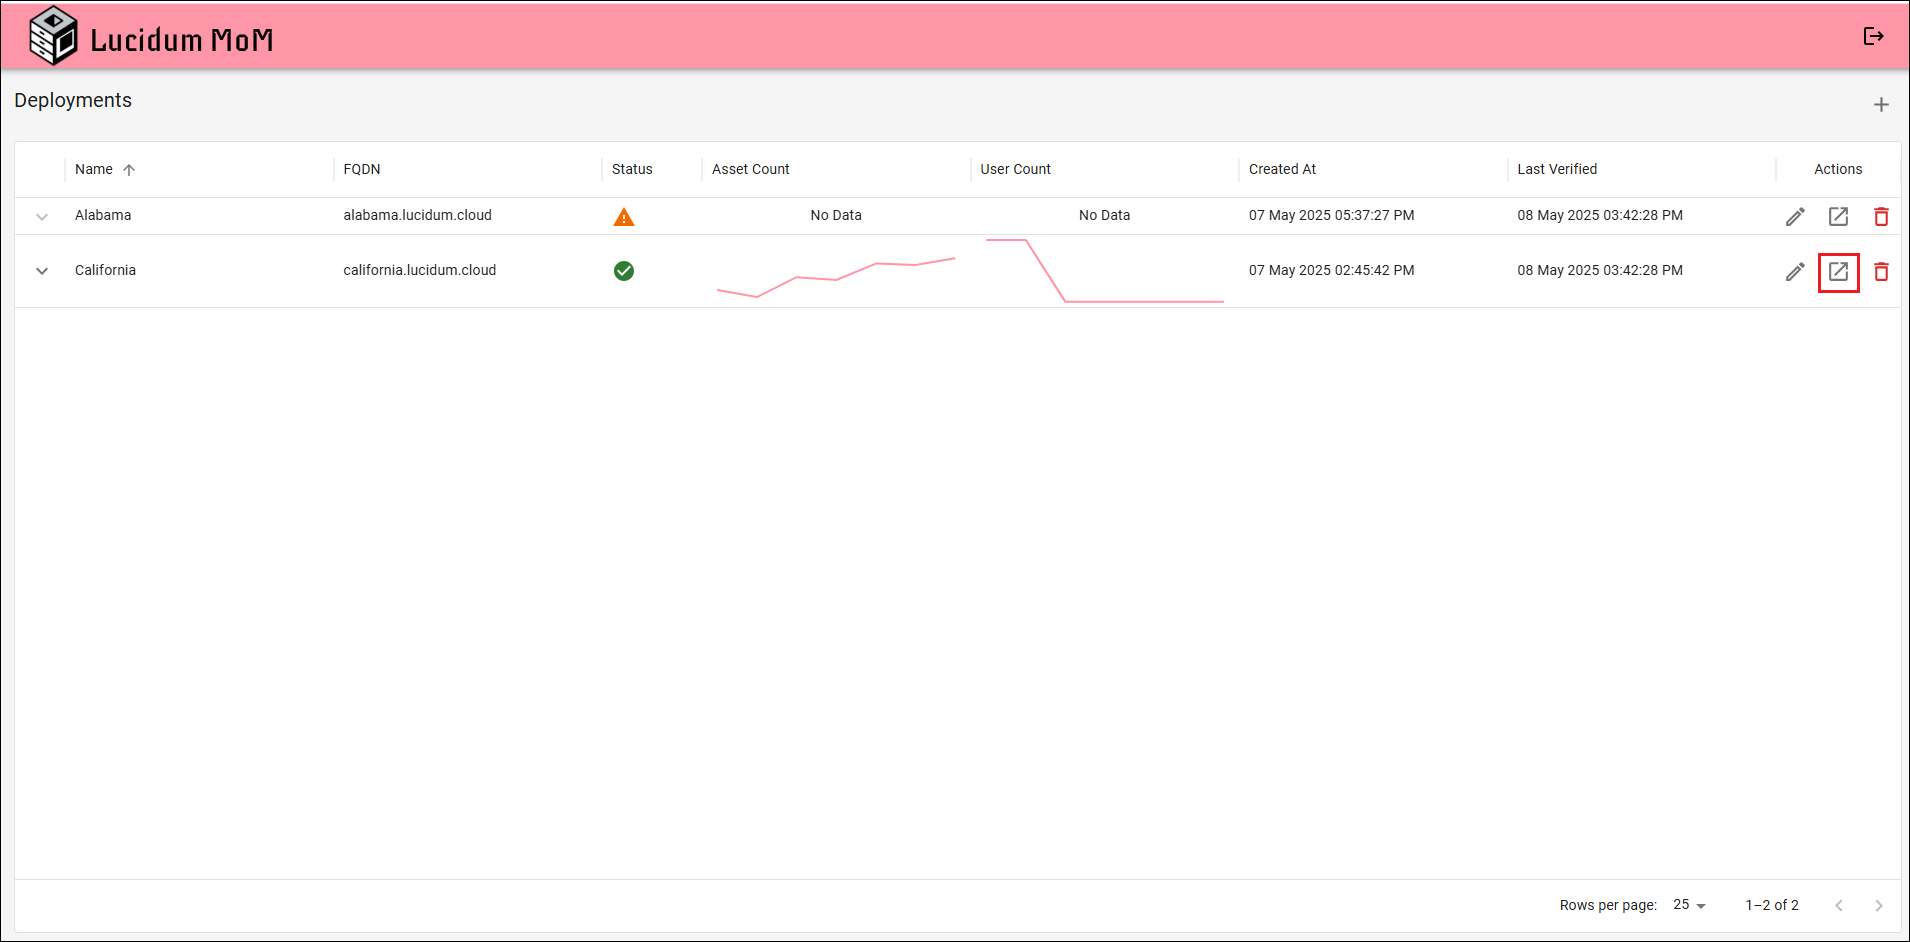
You can access a Lucidum system directly from MoM, allowing you to manage your Lucidum systems from a single terminal.
To access a Lucidum system from MoM:
-
Log in to MoM.
-
Find the Lucidum system you want to manage.
-
Click the Visit Deployment (box with diagonal arrow) icon for the Lucidum system.
- The browser spawns a page where you can log in to the Lucidum system.
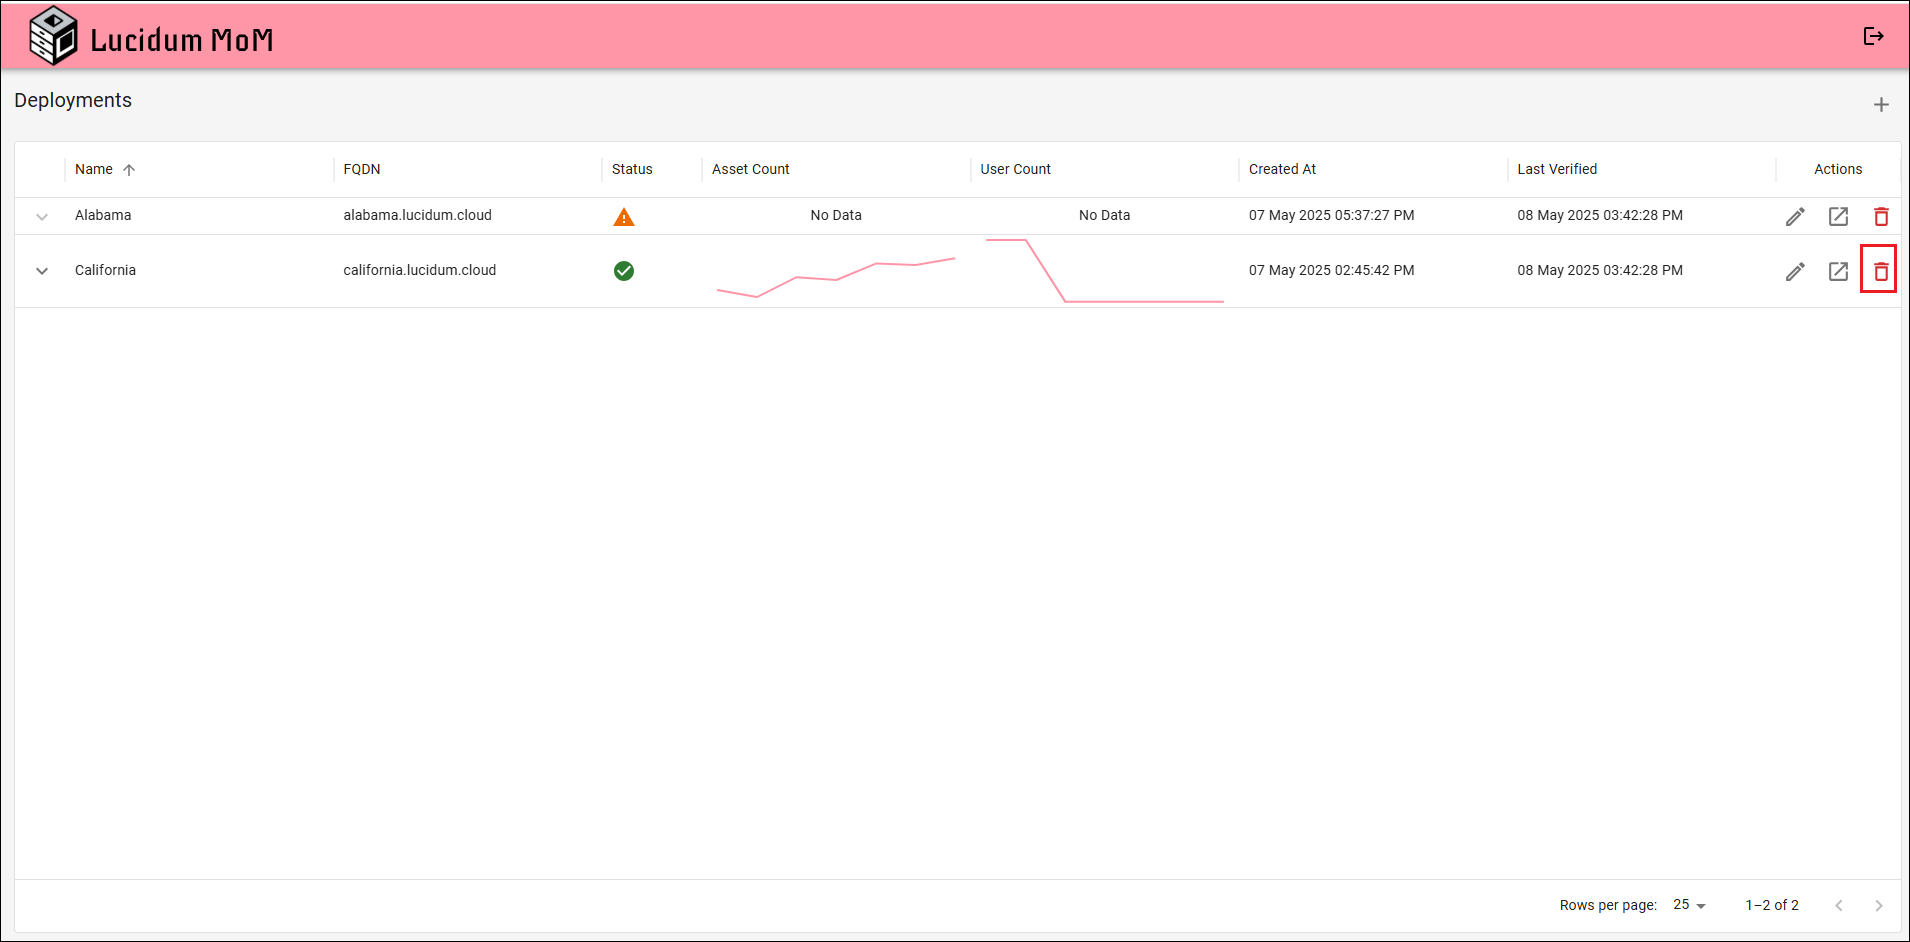
Deleting a Lucidum System from MoM #
To delete a Lucidum system from MoM:
NOTE: These actions do not delete the Lucidum system. They delete the connection between MoM and the Lucidum system.
-
Log in to MoM.
-
Find the Lucidum system you want to delete.
-
Click the Delete Deployment (trashcan) icon for the Lucidum system.
- When prompted, click Confirm to delete the Lucidum system from MoM.